| North American Regional Climate Change Assessment Program |
| About NARCCAP | |
|
|
Program Abstract |
| NARCCAP Goals | |
|
|
Program Plan |
|
|
Participants |
| Contact | |
| NARCCAP Experiment | |
|
|
Experiment 0 |
| - Validation Data | |
| - Exp. 0.0 Results | |
| - Exp. 0.1 Results | |
| - Exp. 0.2 Results | |
| - SAME Results | |
| - Time Series: PCP | |
| - Time Series: TMAX | |
| - Time Series: TMIN | |
| - Taylor Diagrams: PCP | |
| - Taylor Diagrams: TMAX | |
 |
|
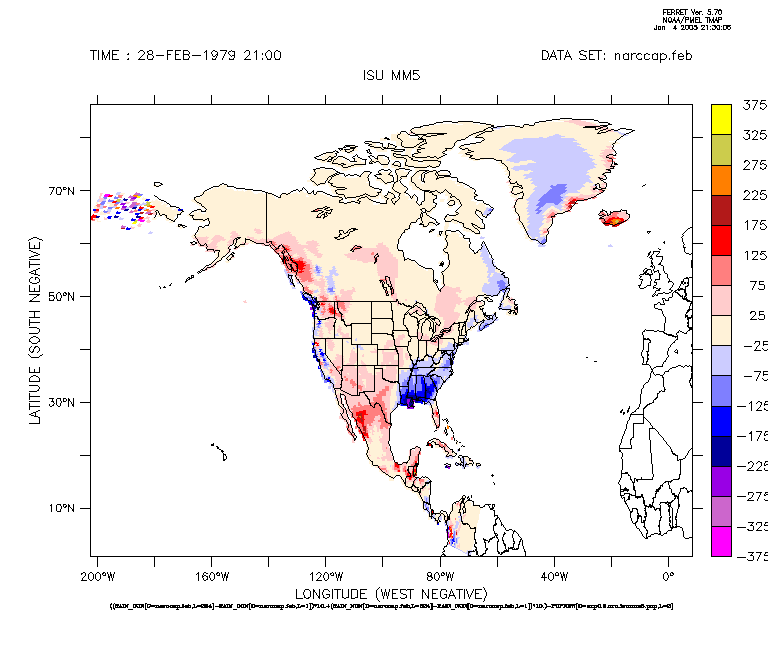
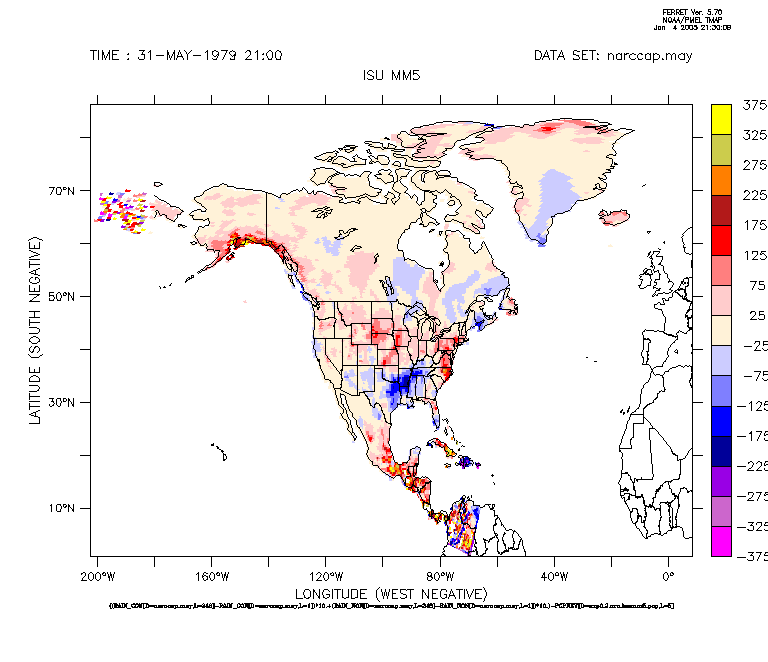
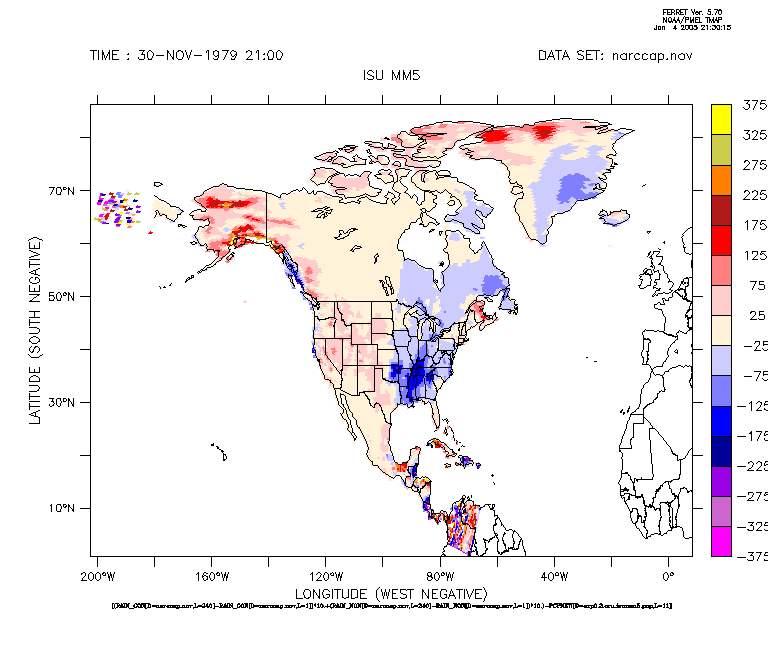
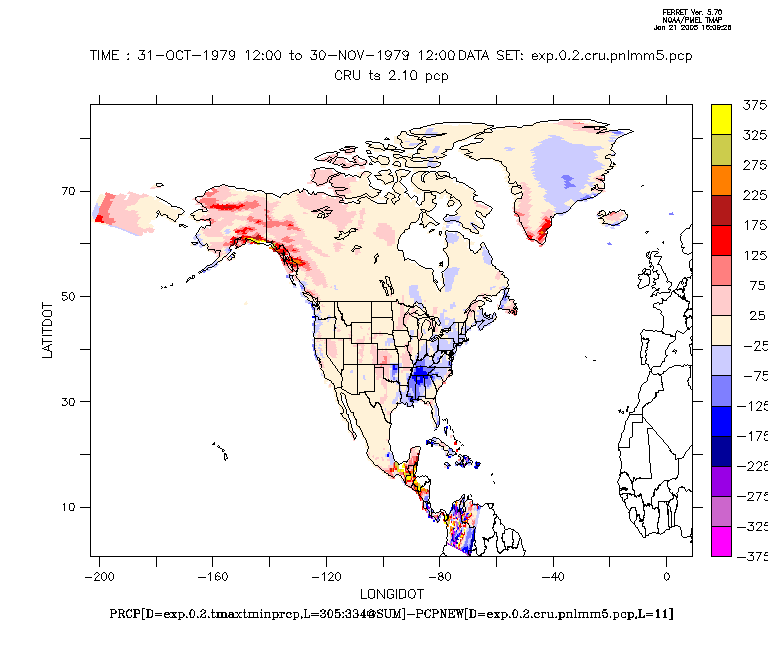
| Results from Experiment 0.2 |
|
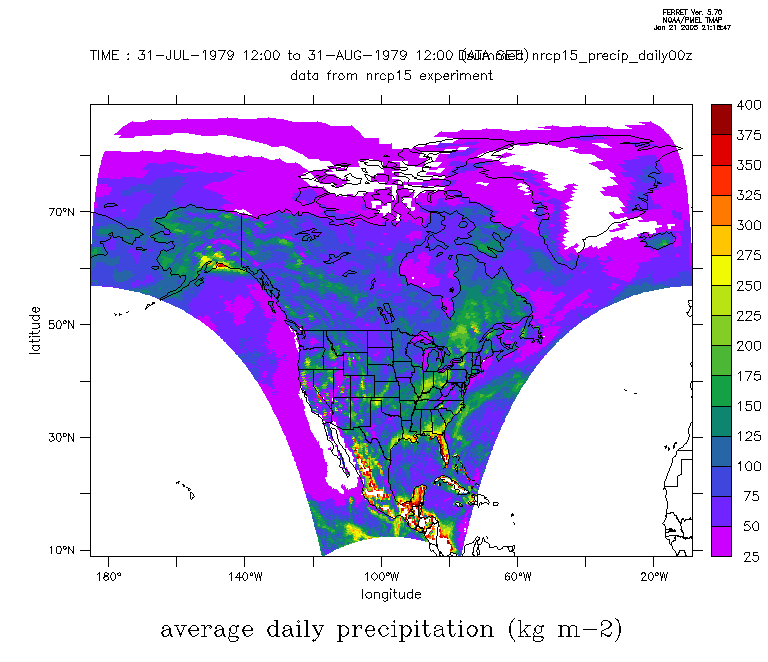
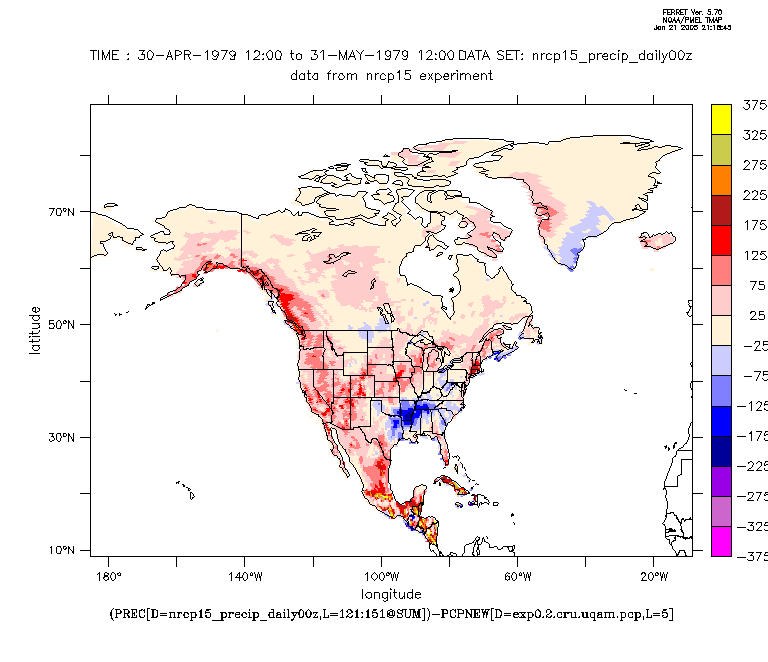
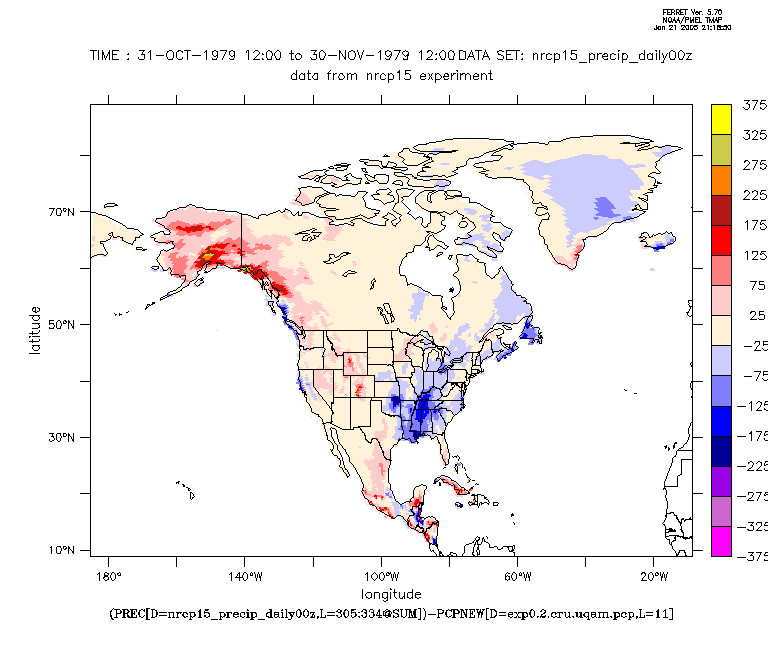
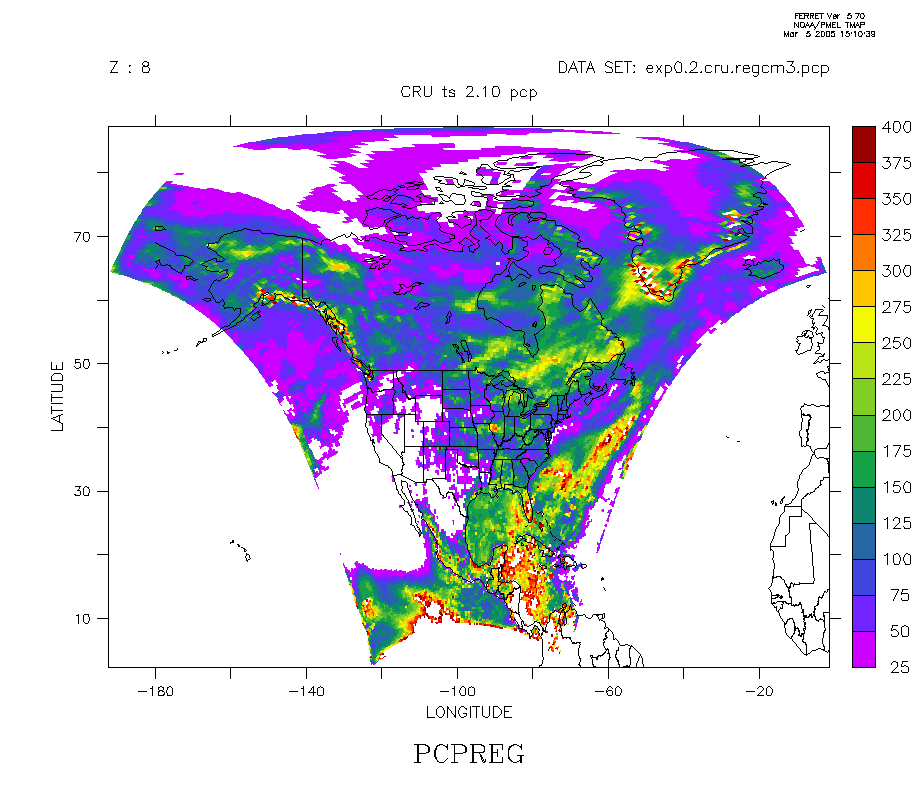
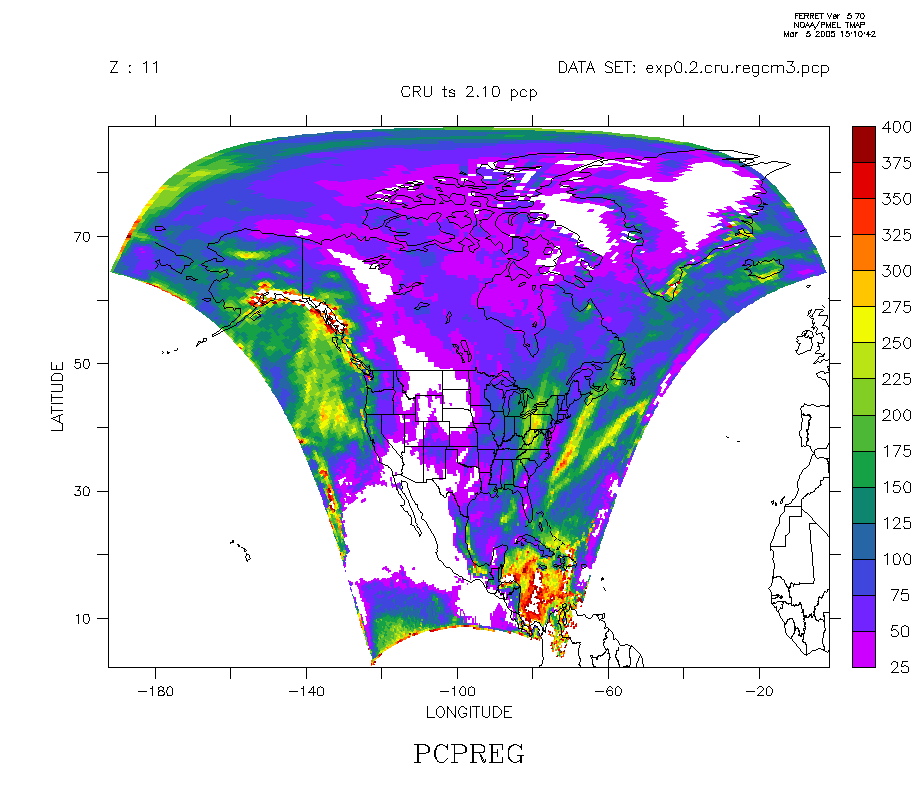
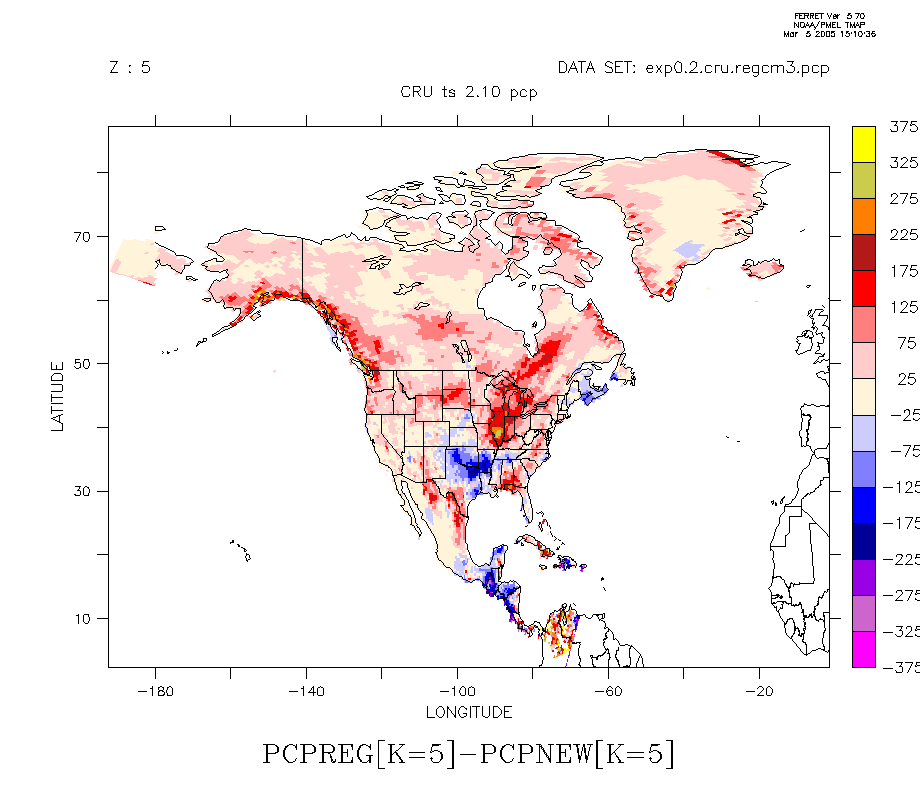
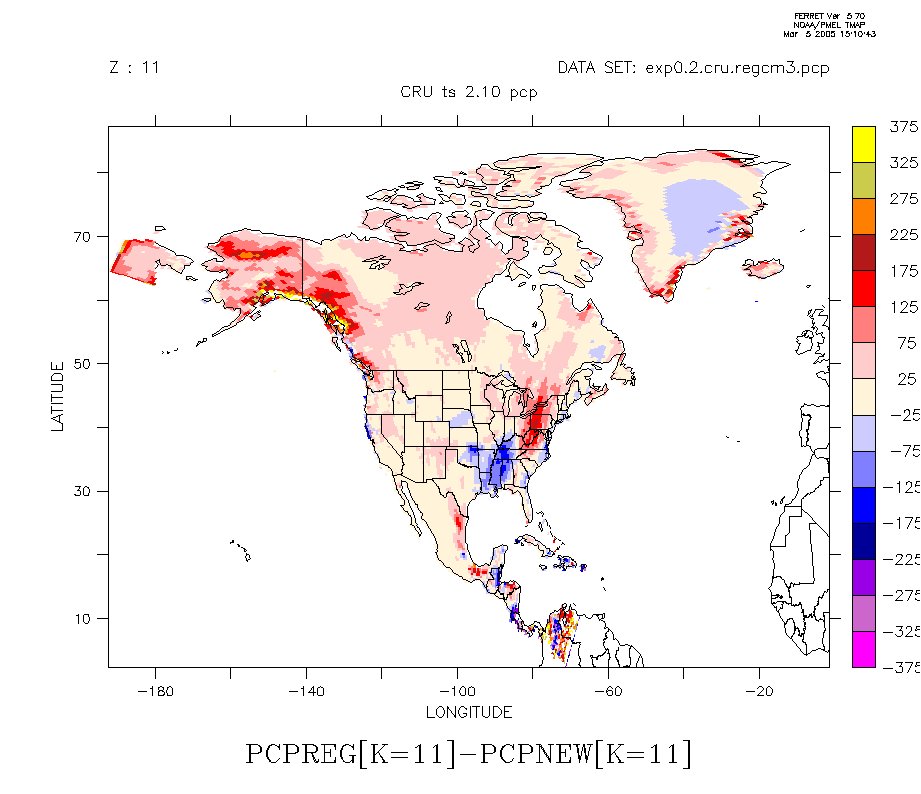
Validation data is bi-linearly interpolated to the model native grid. For a larger image of the data, click on a thumbnail image to view the full image in a new browser. Definition of Metrics Bias: Difference of time average quantities Use the following links to see plots of other variables: 500 hPa Height Maximum Temperature Minimum Temperature Precipitation
|


