North American Regional Climate Change Assessment Program
    Home Taylor Diagrams for Experiment 0
NARCCAP  
NARCCAP
  About NARCCAP
NARCCAP Program Abstract
NARCCAP Goals
NARCCAP Program Plan
NARCCAP Participants
Contact
  NARCCAP Experiment
NARCCAP Experiment 0
    - Validation Data
    - Exp. 0.0 Results
    - Exp. 0.1 Results
    - Exp. 0.2 Results
    - SAME Results
    - Time Series: PCP
    - Time Series: TMAX
    - Time Series: TMIN
    - Taylor Diagrams: PCP
    - Taylor Diagrams: TMAX


NARCCAP
Taylor Diagrams for Experiment 0
 
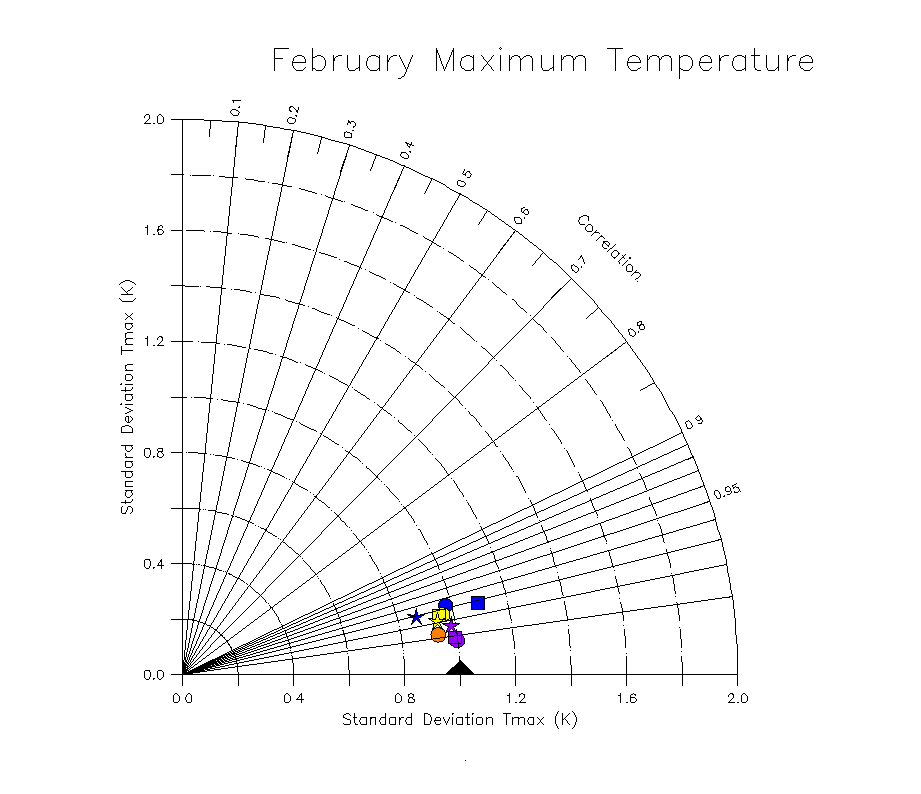
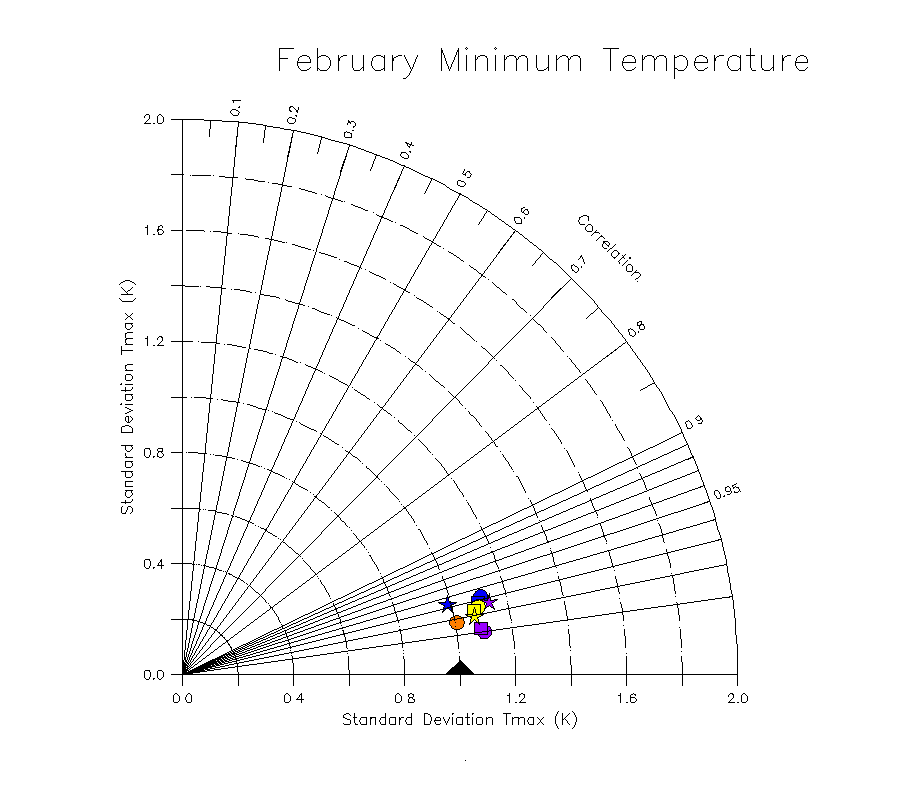
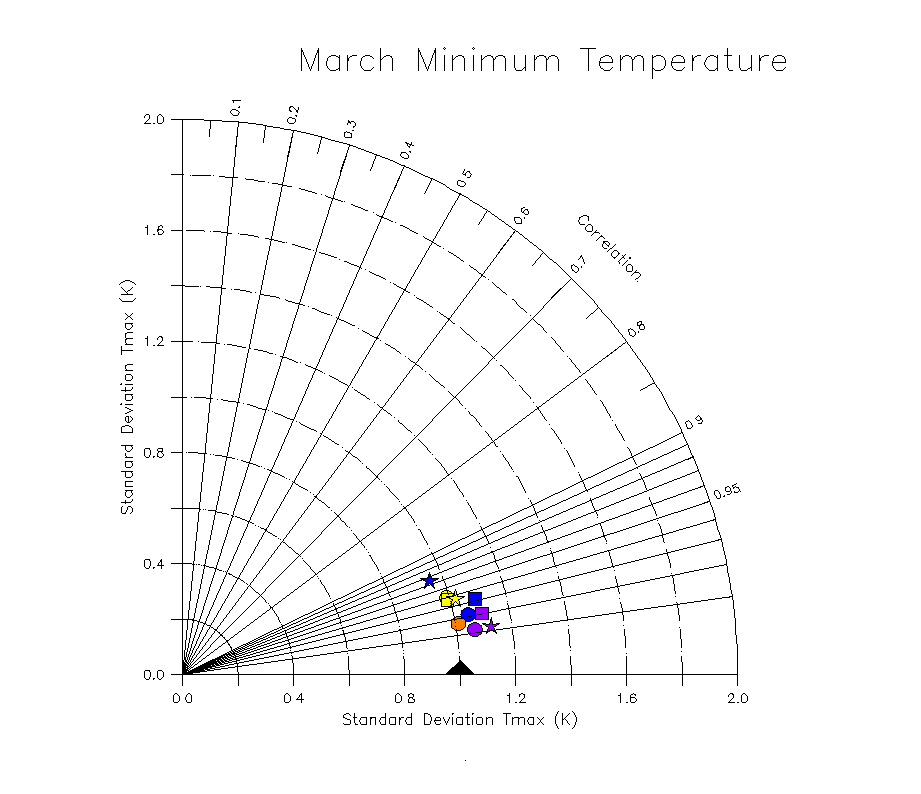
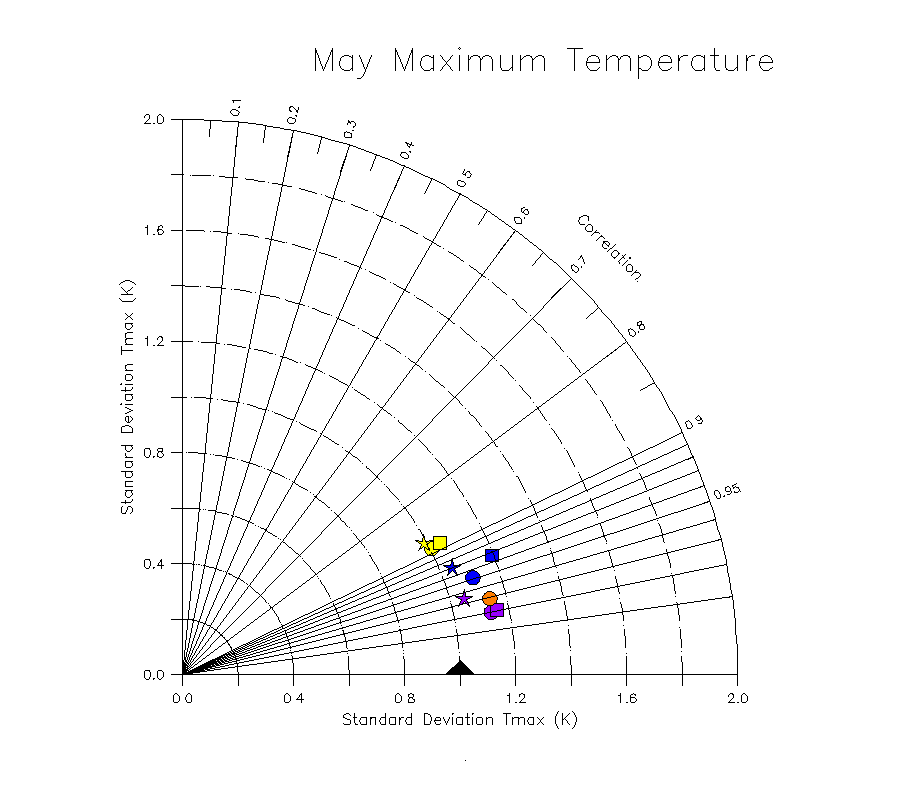
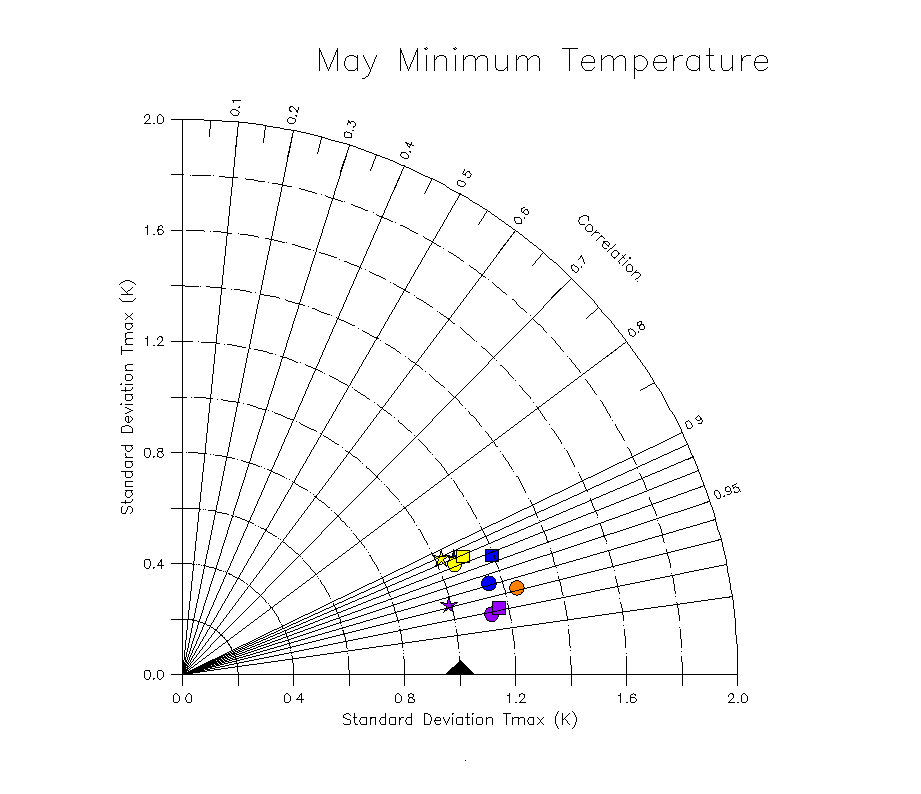
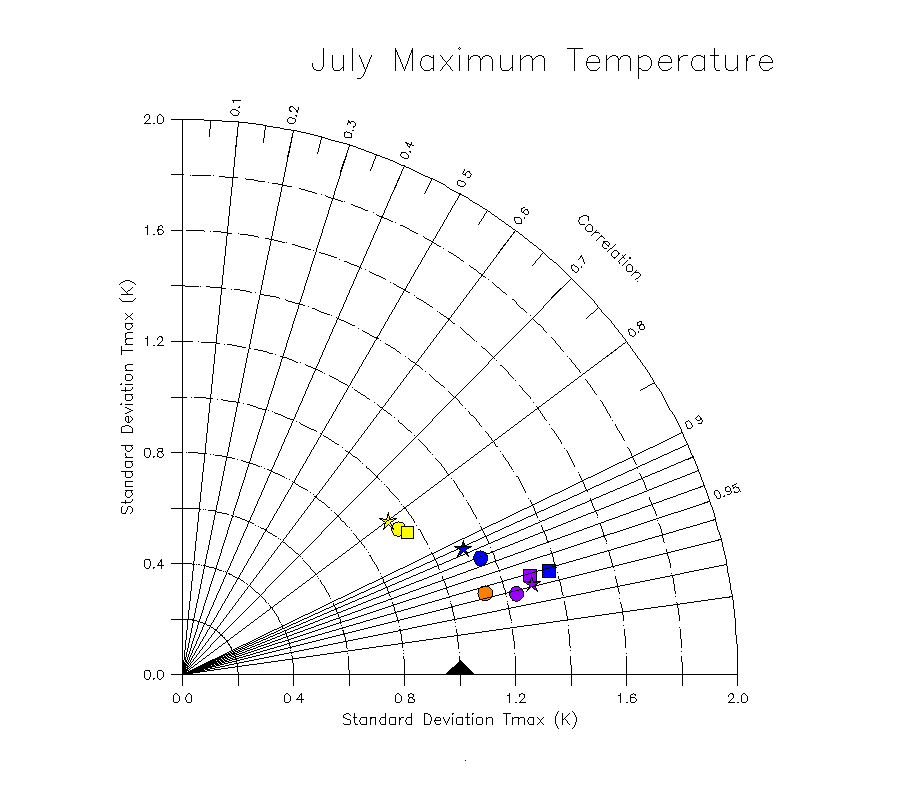
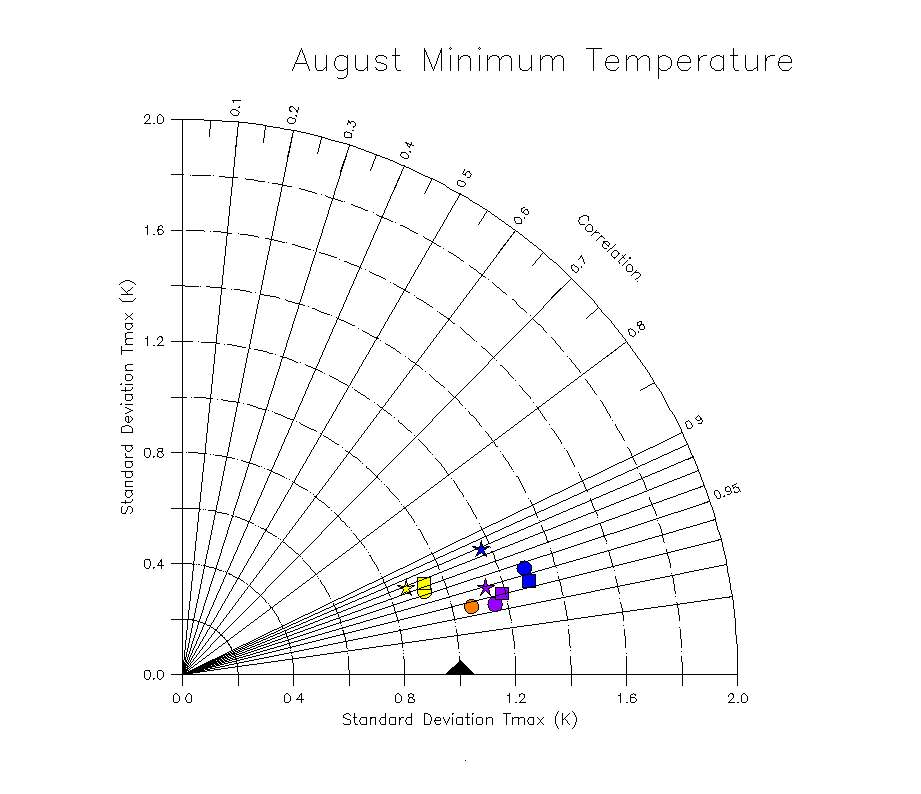
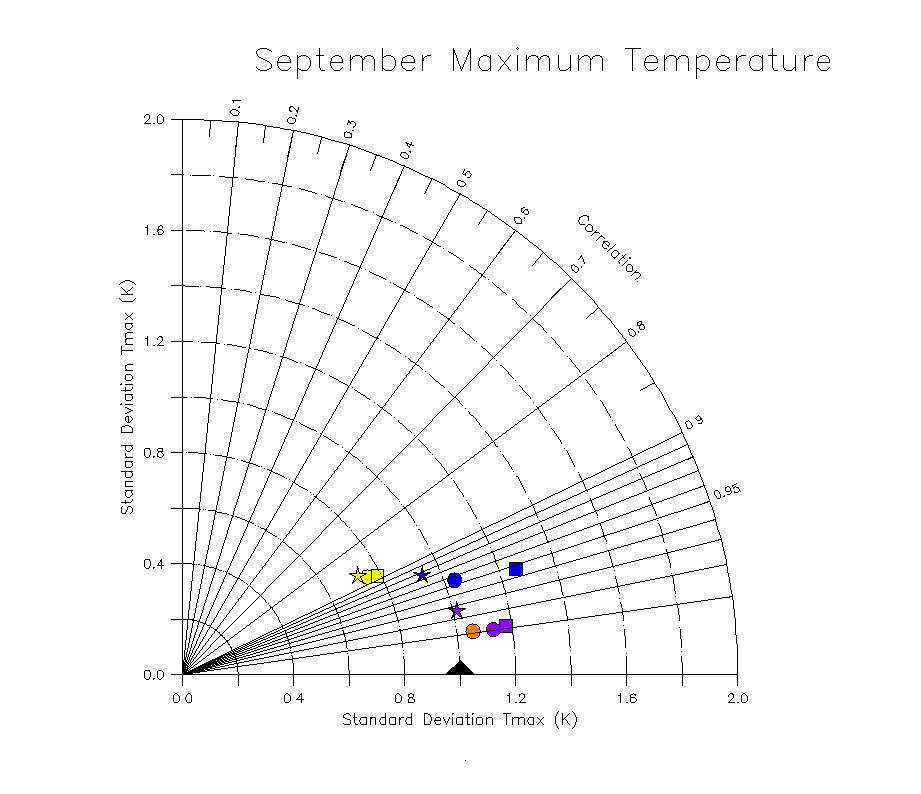
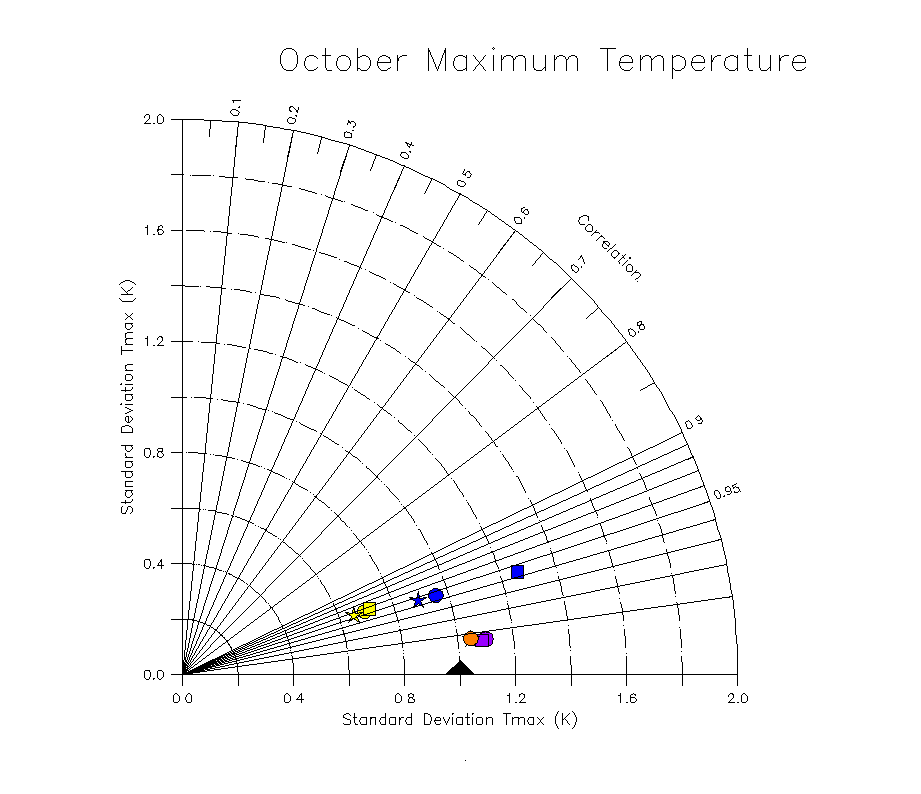
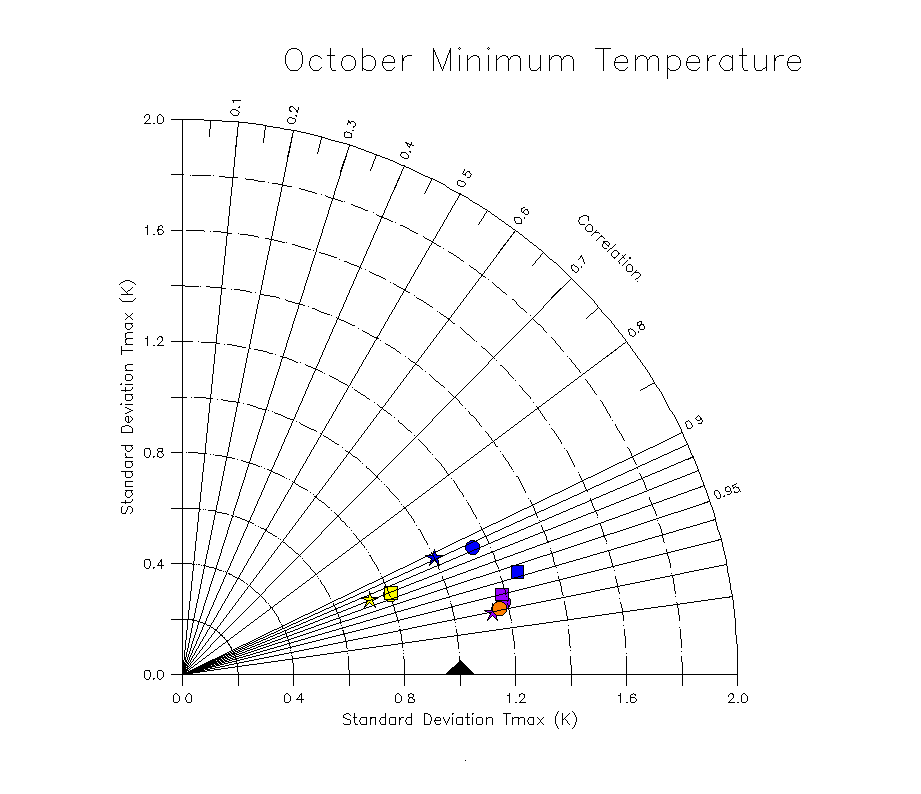
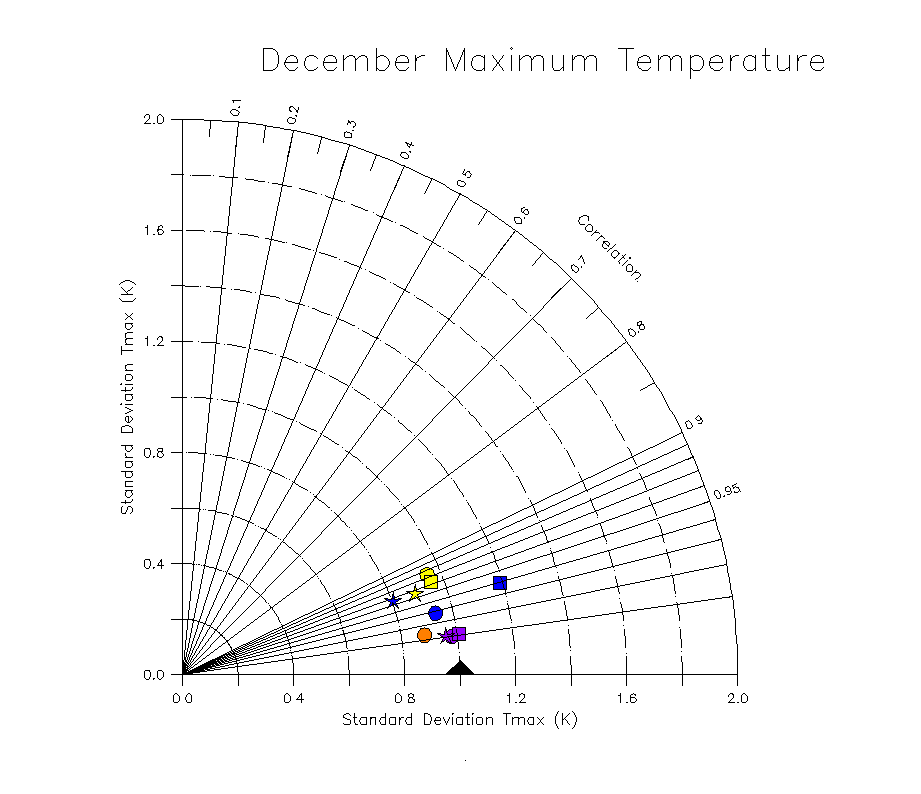
Observed maximum and minimum temperature and precipitation is taken from CRU2.1 data set. NCEP/NCAR Reanalysis-II data is used as a proxy for observed 500 hPa height. Standard deviations are normalized by the observed standard deviation. Validation data are bi-linearly interpolated to the model native grid. To view a full image in a new browser, click on a thumbnail image.

Color scheme:
blue: ISUMM5
orange: ECPRSM
purple: PNLMM5
yellow: CRCM

Symbol scheme:
dot: Experiment0.0
square: Experiment0.1
star: Experiment0.2

Example: Blue Dot is ISUMM5-Experiment0.0
Note: Black Triangle represents observations


Maximum Temperature
Minimum Temperature
January
February
March
April
May
June
July
August
September
October
November
December

 
top of page