Next: US Grid for Regional Climate Model Results
Back to the Main Page

Copyright/Trademark Legal Notice
Snow Cover Simulation
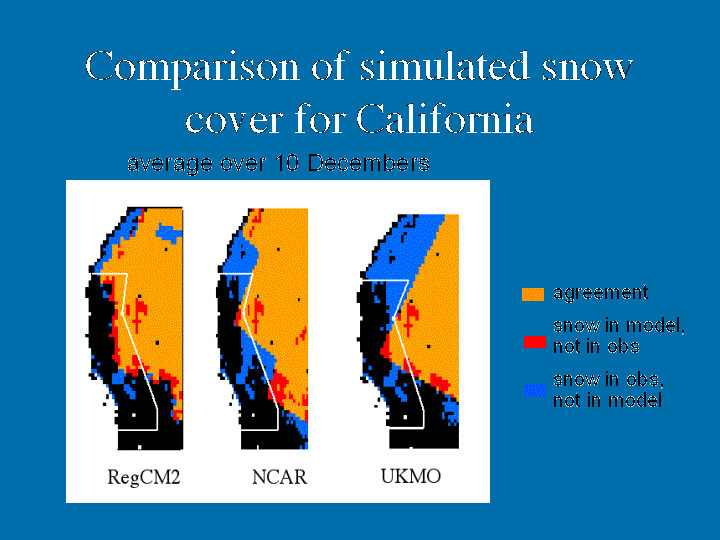
The figure below displays a comparison of snow cover simulated by two global models and a regional model as evidence of the value of higher resolution in simulating meteorological conditions of importance for impacts assessment. Orange areas indicate regions where the model agreed with observed snow cover. Red areas depict locations where there was snow in the model but not in the observations, and blue areas indicate areas with snow in the observations but not in the model. Note that the regional model has more orange area (agreement) and less blue (disagreement).
Next: US Grid for Regional Climate Model Results

Back to the Main Page

Copyright/Trademark Legal Notice